Author: Austin Wang
Daily MLB In-season Trends to Watch | Saturday, June 8, 2024
Daily MLB In-season Trends to Watch | Friday, June 7, 2024
Daily MLB In-season Trends to Watch | Thursday, June 6, 2024
Daily MLB In-season Trends to Watch | Wednesday, June 5, 2024
Daily MLB In-season Trends to Watch | Tuesday, June 4, 2024
Kyrie’s Return to Boston: Key Betting Insights for the 2024 NBA Finals
Kyrie Irving #11 of the Dallas Mavericks drives against Derrick White at the TD Garden on March 1, 2024. (BRIAN FLUHARTY / GETTY IMAGES)
The NBA Finals are here! To no one’s surprise, the Celtics reigned supreme in the Eastern Conference. They’ve benefited from injuries to key players on their opponents’ rosters in each round. Celtics haven’t been fully healthy either – oft-injured big man Kristaps Porzingis missed Rounds 2 and 3. He is expected back in the lineup; however, rust and conditioning could be potential issues.
Hats off to the Dallas Mavericks! While their potential was recognized, many are surprised to see them outlast the Nuggets, Timberwolves, and Thunder. Luka Doncic and Kyrie Irving have formed an unstoppable duo, consistently delivering in clutch moments. Mid-season acquisitions P.J. Washington and Daniel Gafford have excelled in their roles, while rookie Dereck Lively made significant contributions, especially in the series against the Thunder.
A lot of juicy narratives are at play. Irving’s short stint with the Celtics (2017-2019) held much promise but ultimately fell short, leading to significant hostility between Irving and the Boston fans. Expect an earful directed at Irving from the Boston faithful at TD Garden. On the other side, Porzingis will face his former team, the Mavericks, where his two-and-a-half season tenure was marred by injuries and chemistry issues.
Here are a few bullet points for each team and a link to the matchup page where you can dive into advanced stats, trends, splits, and situational spots. Sign up for access to this website free until August 1.
1. Boston Celtics vs. 4. Dallas Mavericks
Click here for The Money Baller matchup page for stats, trends, splits, and systems for this matchup.
Boston Celtics
- The Boston Celtics have demonstrated their strength in the first half throughout the season, boasting an impressive 64-31-1 ATS record in the first half. This trend continued into the playoffs, where they went 7-3 ATS in the first half in the first two rounds, but only 1-3 1H ATS in the Conference Finals against the Pacers.
- The home team in Game 1 of the NBA Finals has gone 18-3 SU and 17-4 ATS in the history of the KillerSports.com database.
- Teams playing as home favorites in Game 1 with a rest advantage have historically performed exceptionally well. Data from the KillerSports.com database reveals a strong 61-42 (59%) ATS record (5-2 ATS in these playoffs) for such teams, underscoring the significance of rest and home-court advantage in setting the tone for the series. Specific to the NBA Finals, this trend has gone 8-2 ATS.
- Favorites playing in Game 1 after a sweep are 23-14-1 ATS. These stats favor the under as well.
Dallas Mavericks
- The Mavericks have established themselves as road warriors, boasting an impressive 33-16-1 ATS record in road games this season. Their ability to perform well away from home speaks to their resilience and adaptability. They are 7-2 ATS on the road in the postseason.
- The Mavericks are 27-6 SU and 25-8 ATS when both Doncic and Irving suit up, dating back to March 7, 2024.
- Unlike the Celtics, the Mavericks are not a strong first-half team. This season, they are 57-41-1 ATS for the full game but only 48-50-1 ATS in the first half.
- Some interesting stat comparisons to note in these playoffs:
– The Mavericks rank 2nd in Free Throw Rate, but the Celtics are 1st in Free Throw Rate allowed.
– The Mavericks’ duo of young big men has propelled them to the 3rd best Offensive Rebounding Percentage in the playoffs, while the Celtics are 1st in Offensive Rebounding Percentage allowed.
– The Mavericks average the most corner three-point attempts in the postseason. However, the Celtics neutralize this, ranking 1st in both Corner 3 attempts allowed and Corner 3 FG% allowed.
Stats and trends are pointing to the Celtics -6.5 and Celtics 1H -3.5. However, the Mavericks have defied odds throughout the playoffs (especially on the road) and have been red-hot as of late. We are eagerly awaiting this Finals matchup!
For a limited time, Basic Access is free until August 1, offering coverage for the majority of the MLB and WNBA season. Plus, with Baller Access, you’ll unlock access to profitable situational systems and exclusive breakdowns that can give you an edge in your betting strategy.
Don’t miss out! Click here to sign up and elevate your betting tools and resources today!
Regression for Lugo? MLB 2024 Early Season Betting Report
Stats updated through June 2, 2024
As the MLB season progresses, several intriguing trends have emerged, highlighting unique performances and patterns among various teams. These stats provide a fascinating lens through which to view the ongoing dynamics of the league.
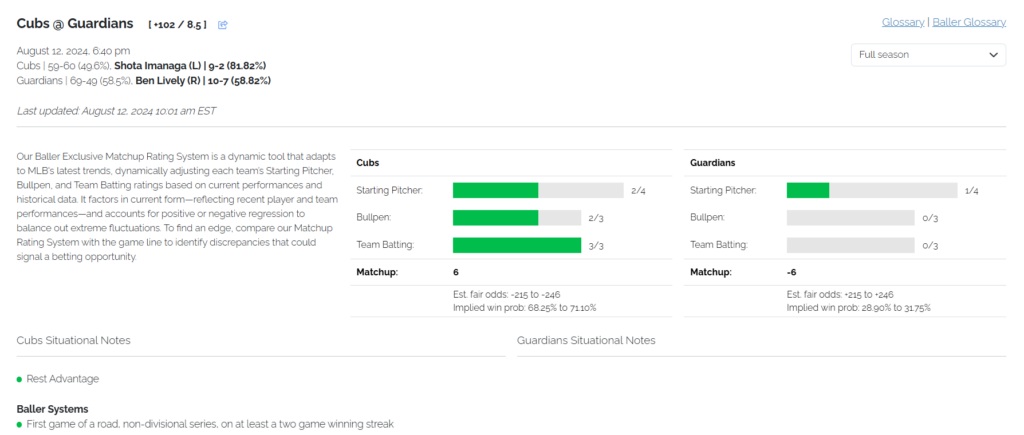
Our matchup pages are an excellent tool for you to dive into each MLB matchup. We will still be providing our trends, now only available to our ‘Baller Access‘ subscribers.
Most/Least Profitable Teams
As usual, the Yankees, Phillies, and Dodgers dominate the headlines, but the AL Central has been turning heads this season. The Guardians and Royals have emerged as the two of the most profitable teams in the league. Seth Lugo has been spectacular, making an early case for the Cy Young Award. While the Guardians’ metrics aren’t eye-popping, they rank third in the league in runs scored.
The biggest surprise of all? The Nationals. With an average betting line of +149 this season, they are hovering around .500 and overachieving, making money for their bettors. Trevor Williams has been incredible and consistent, with the Nationals going 9-2 when he starts.
The White Sox have been an obvious fade, but what about the Astros? They have gotten off to a slow start and are currently seven games under .500. They’ve been the most profitable team to fade, as the market still remains bullish on them. They also got off to a slow start last season, so there’s still a chance for them to turn it around.
The Marlins have been a great fade overall, especially when they face lefty starting pitchers. They are 2-18 straight up in this situation, making this our favorite trend of the season.
Best Over Teams/Best Under Teams
The Brewers’ offense has been hot this season, leading the league in overs. The Tigers have gone 12-3 to the over in their last 15 games. Surprisingly, the Marlins find themselves on this list due to their defense and pitching ranking at the bottom of the league.
The Rangers, Braves, and Astros have suffered from high market expectations and underperforming offenses. The Astros have gone under in eight straight games. In late April and early May, the Braves had a stretch where they went 20-1 to the under. The Rangers have gone 9-2-1 to the under in their last 12 games, while the Mariners are 7-2 to the under in their last nine.
Best/Worst Starters
To clarify, these statistics represent the team’s full game record and ROI when these respective pitchers start the game, so they are not fully indicative of the pitchers’ individual performances. For instance, Brayan Bello, despite a 4.18 ERA, is one of the names on the list of profitable starters. On the other hand, poor Reese Olson is pitching well, but the Tigers’ bullpen and offense haven’t been able to provide him with any support.
There have been dominant performances from some unexpected names on this list. As mentioned earlier, T. Williams has been the most profitable pitcher this year. Additionally, two Royals pitchers, Lugo and Alec Marsh, have made the list.
Meanwhile, there are some familiar and expected names, such as Yusei Kikuchi as a starter to fade. Andrew Heaney just picked up his first win on May 28 and is looking to turn around his rough start, but he has been one of the most profitable starters to play against. Similarly, Trevor Rogers, Hunter Brown, and Mike Soroka have been automatic fades this season.
Overrated pitchers/Underrated Pitchers
To identify potential/negative regression, here are a few tips on what to analyze:
- Compare FIP to ERA: A large discrepancy suggests likely regression. Lower FIP than ERA indicates positive regression; higher FIP than ERA indicates negative regression.
- Check BABIP: Significant deviations from league average or career norms indicate luck and potential regression.
- Evaluate LOB% and HR/FB Ratios: Extreme values suggest potential regression to the mean.
- Monitor K% and BB%: Stability in these metrics indicates reliability in performance prediction.
Astros rookie Spencer Arrighetti might be a player to watch as the season progresses. Although he has had a rough start, underlying metrics suggest that bad luck has played a significant role. Cole Ragan’s FIP is excellent, but his ERA has suffered from two bad starts – there were two starts where he gave up seven runs.
On the other hand, advanced metrics indicate that Lugo is a candidate for negative regression. James Paxton, currently boasting a 5-0 win-loss record, is pitcher that may be over-valued playing for the high-profile Dodgers, who may face regression. Ronel Blanco may be heading that direction already after enduring his worst start of the season by giving up four runs.
Interesting Trends of the Year
- Marlins are 2-18 SU against left-handed pitchers this season.
- Mets: 17-8 to the over on the road, 20-12 to the under at home
- Giants: 19-9-1 to the over on the road, 17-11-1 to the under at home
- Marlins: 22-8 to the over at home (13-3 to the over run), 17-10-1 to the under on the road
- Guardians: 20-6 home record
- Angels: 7-21 home record (while they are 14-15 SU on the road)
- Phillies: 19-2 run at home (23-8 for the season at home)
If you have been a fan of our daily in-season trends pages, sign up for Baller Access for continued access!
NBA Playoffs 2024 | Conference Finals Preview
The conference semi-finals were nothing short of thrilling and full of surprises! The series between the New York Knicks and Indiana Pacers, as well as the Denver Nuggets and Minnesota Timberwolves, both went to a decisive Game 7. The Oklahoma City Thunder and Dallas Mavericks also delivered an electrifying showdown. Although the Boston Celtics versus Cleveland Cavaliers series lacked excitement, it was largely due to injuries on the Cavaliers’ side.
We witnessed a changing of the guard with the Timberwolves and Pacers, two rising teams that fought hard to advance. Meanwhile, Luka Doncic and the Dallas Mavericks secured their spot in the conference finals for the second time in three seasons.
Kristaps Porzingis still remains sidelined for the Celtics with a calf injury. He is likely missing the first two games of the conference finals but there’s optimism he’ll return sometime during the series.
Similar to the first two rounds, here are 3 bullet points for each team and a link to the matchup page where you can dive into advanced stats, trends, splits, and situational spots. Sign up for access to this website free until August 1.
3. Minnesota Timberwolves vs. 4. Dallas Mavericks
Click here for The Money Baller matchup page for stats, trends, splits, and systems for this matchup.
Minnesota Timberwolves
- The Wolves are 5-1 SU and ATS on the road in this playoffs.
- Wolves/Mavericks have gone 7-1-1 to the under in their previous nine matchups (dating back to March 21, 2022), averaging 219.7 points per game.
- A notable weakness for the Timberwolves this season is their slow starts at home, where they are 16-30 ATS (34.8%) in the first half. On the other hand, the Mavericks are 25-21-1 (54.3%) in the first half on the road.
Dallas Mavericks
- The Mavericks have established themselves as road warriors, boasting an impressive 30-16-1 ATS record in road games this season. Their ability to perform well away from home speaks to their resilience and adaptability.
- The Mavericks are ranked 2nd in Offensive Rebounding % in the playoffs; however, the Timberwolves are 3rd in Offensive Rebounding % allowed.
- Teams playing in Game 1 after a seven-game series (against a team that did not play a seven-game series) are 19-33-1 ATS in the history of the Killer Sports SDQL database. This trend supports a play on the Mavericks in Game 1.
1. Boston Celtics vs. 6. Indiana Pacers
Click here for The Money Baller matchup page for stats, trends, splits, and systems for this matchup.
Boston Celtics
- The Boston Celtics have demonstrated their strength in the first half throughout the season, boasting an impressive 63-28-1 ATS record in the first half. This trend continued into the playoffs, where they went 7-3 ATS in the first half in the first two rounds, highlighting their ability to start games strong.
- Teams playing as home favorites in Game 1 with a rest advantage have historically performed exceptionally well. Data from the KillerSports.com database reveals a strong 61-41 (59%) ATS record (5-1 ATS in these playoffs) for such teams, underscoring the significance of rest and home-court advantage in setting the tone for the series.
- Teams playing in Game 1 after a seven-game series (versus one that did not play a seven-game series) are 19-33-1 ATS in the history of the Killer Sports SDQL database. This trend supports a play on the Celtics in Game 1.
Indiana Pacers
- The Pacers have defied odds this season, sporting a solid 25-17-2 ATS record as underdogs. Their ability to exceed expectations underscores their resilience and competitive spirit on the court.
- In their previous 18 games, the Pacers have showcased their offensive firepower, with a 13-5 record to the over. They are 7-1 to the over in their last 8 games as underdogs, highlighting their ability to generate scoring opportunities and capitalize on offensive possessions.
- Contrary to the Celtics, the Pacers have been a poor first-half team. They have a 46-47-3 ATS record in the first half, compared to 53-42-1 ATS in the full game. They were 18th in Net Rating in the first half and 5th in Net Rating in the second half.
NBA Playoff Betting: Leveraging Free Throw Rate
The Impact of Free Throw Rate on NBA Playoff Totals
In the world of NBA playoff betting, understanding the nuances of Free Throw Rate (FTR) can provide a distinct advantage. There is a notable correlation between FTR and game totals: higher rates often lead to games going over the total points line, while lower rates typically result in games staying under.
Strategic Application in Live-Betting and Analysis
Predicting free throw attempts before a game begins is challenging; however, recognizing the trends in how a game is officiated can offer valuable insights, particularly for live-betting. Observing whether referees are calling fouls frequently or sparingly during a game can help bettors make informed decisions on the fly.
Historical Performance and Trends
Looking at historical data can also reveal patterns that are invaluable for betting strategies. For instance, teams that had a FTR of 35% or higher in a game have subsequently gone 79-46-8 (63.2%) to the under since the 2014-2015 season. Even more compelling, these teams have gone 35-15 (70%) to the under in the last two playoff seasons when following a high-FTR game.
Insights for Baller Access Members
For members of Baller Access, our platform automatically flags matchups where this high Free Throw Rate system is active, simplifying the betting process and enhancing your strategy.
Understanding Free Throw Rate Norms and Variations
The average FTR in NBA games typically hovers around 28%. A rate of 35% is considerably higher and indicative of a game where many fouls were called. Not only can excessive free throws slow down the game and frustrate fans (we’re looking at you, Luka!), but they can also affect the pacing and strategy of the opposing team.
Teams and referees often adjust after a high FTR game. The following game might see fewer fouls called as referees use a looser whistle, or opposing teams might alter their play to avoid fouling. These adjustments can lead to a lower scoring game, making the ‘under’ a potentially profitable bet.
To stay ahead of the game and access expert analysis and real-time data, subscribe to our “Baller Access” premium service, ensuring you never miss an opportunity to bet smarter.